Watch the 2012 NRL TV commercial.
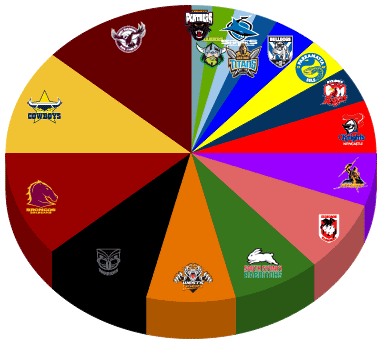
A few friends and I sat down and counted the number of times each team appeared and this is what we found.
| Team | 1st half | 2nd half | Appearances | Position | 2011 Members |
|---|---|---|---|---|---|
| Manly | 4 | 3 | 7 | 1 | 9,000 |
| Cowboys | 5 | 1 | 6 | 7 | 7,600 |
| Broncos | 4 | 2 | 6 | 3 | 14,500 |
| Warriors | 2 | 3 | 5 | 2 | 8,500 |
| Tigers | 3 | 1 | 4 | 5 | 8,700 |
| Rabbitohs | 2 | 2 | 4 | 10 | 20,000 |
| Dragons | 3 | 1 | 4 | 6 | 19,000 |
| Storm | 2 | 1 | 3 | 4 | 8,700 |
| Knights | 0 | 3 | 3 | 8 | 9,000 |
| Roosters | 1 | 1 | 2 | 11 | 9,500 |
| Eels | 1 | 1 | 2 | 14 | 11,000 |
| Bulldogs | 1 | 1 | 2 | 9 | 13,500 |
| Titans | 0 | 1 | 1 | 16 | 8,000 |
| Sharks | 1 | 0 | 1 | 13 | 6,500 |
| Raiders | 0 | 1 | 1 | 15 | 9,000 |
| Panthers | 0 | 1 | 1 | 12 | 6,000 |
As you can see some teams received only a single appearance where others received 5 or more. The average was 3 appearances.
The Cowboys and Broncos had 2 appearances before 10 of the teams had appeared once. 3 teams had 3 appearances before 7 had any.
The Titans, Knights, Panthers and Raiders didn't appear in the first half of the ad. Most of these teams then didn't receive another appearance except for the Knights who ended up receiving the average by the end. The Raiders only appeared after three quarters of the ad had played.
The spread doesn't exactly reflect team's finishing positions but it must have had some influence. Membership numbers were also not a factor that appeared to significantly influence the number of appearances as the two clubs with the most members were outside of the top 5.
Whenever I see this ad on TV I look for the team I'm a member of, the Raiders, but they appear near the end and then they only appear once. Fans and clubs should tell the NRL that this just isn't good enough and that their teams should be fairly represented.
Comments
Comment by Chevy
If anything the NSW teams should be treated secondary compared to the likes of the Warriors, the QLD teams, Melbourne then Canberra
Add new comment